

Wednesday, March 14, 2007
In June last year, I presented a paper at the Unlocking IP conference, part of which involved collecting data on Australian usage of Creative Commons licences. For example, here's the data I collected in June 2006, organised by licence attribute:
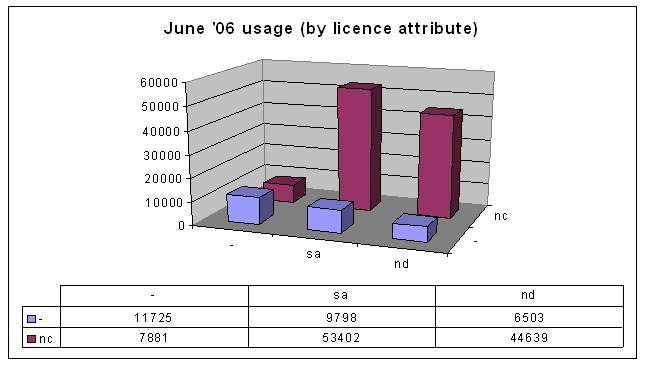 It shows that most people are using the Non-Commercial licences and restricting derivative works.
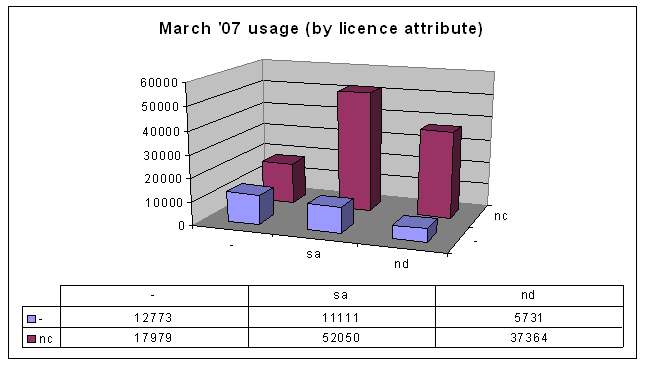
That was all well and good, but then this year I revised my paper for publication in SCRIPT-ed. I wasn't going to gather the data all over again, but then I remembered that Australia now has version 2.5 Creative Commons licences, and I guessed (correctly) that the numbers would be big enough to warrant being included in the paper. Here's the data from March 2007:
Matrix subtraction
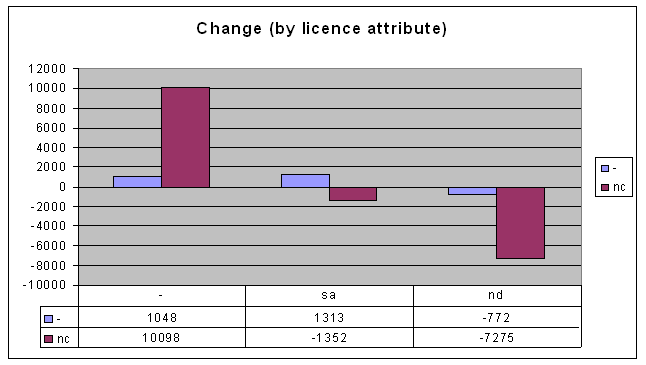
I admit that it looks about the same, but it gets interesting when you subtract the old data from the new data, to find the difference between now and mid-2006:
 So here's my first conclusion, from looking at this graph:
The jurisdiction/version dimension
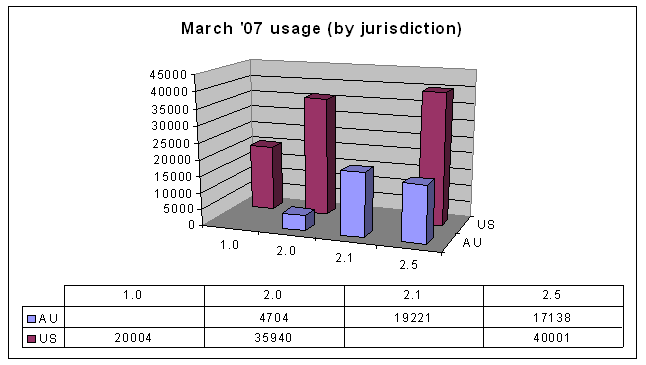
Another way of looking at the data is by jurisdiction and version, instead of by the licences' attributes. Here's the data from June 2006, organised this way:
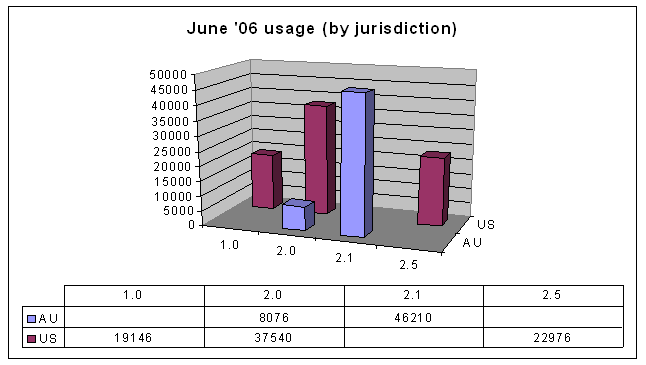 First, note that there was no data (at the time) for Australian version 1.0 and 2.5, and US version 2.1 licences. This is simply because not all jurisdictions have all licence versions.
Some people might be wondering at this stage why there are Australian web sites using US licences. I believe the reason is that Creative Commons makes it very easy to use US (now generic) licences. See http://creativecommons.org/license/, where the unported licence is the default option.
The previous graph, also, is not particularly interesting in itself, but compare that to the current data:
The move away from Australia version 2.1
You can see straight away that there's lots of change in the 2.1 and 2.5 version licences. But take a look at the change over the last 9 months:
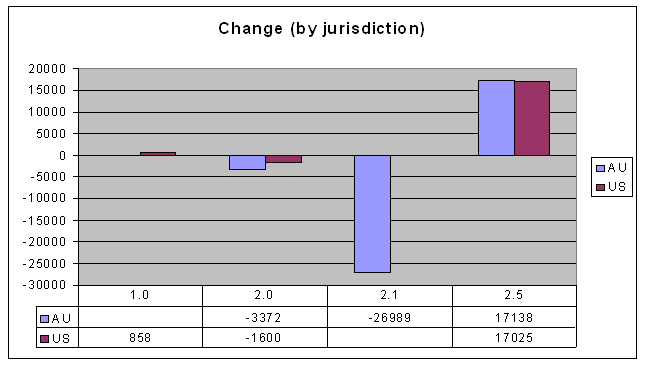 Can that be right? Australian usage of both US and Australian version 2.5 licences has increased as expected (because they are current). But why would the usage of Australian 2.1 licences go down? And by more than the amount of new usage of Australian 2.5 licences? Here are some possibilities:
Methodology
For the record, here's how I collected the data. I did the following Yahoo searches (and 36 others). For each search, Yahoo tells you "about" how many pages are found.
Last word
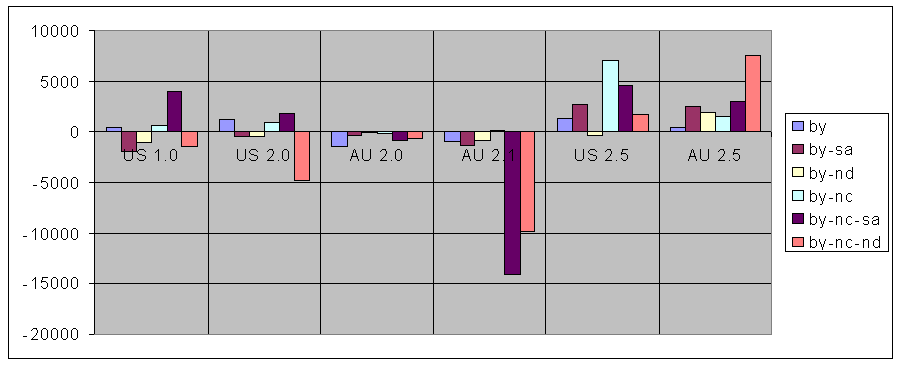
You can see a graph of the change in usage for every licence for every version and both jurisdictions here.
It shows that most people are using the Non-Commercial licences and restricting derivative works.That was all well and good, but then this year I revised my paper for publication in SCRIPT-ed. I wasn't going to gather the data all over again, but then I remembered that Australia now has version 2.5 Creative Commons licences, and I guessed (correctly) that the numbers would be big enough to warrant being included in the paper. Here's the data from March 2007:
Matrix subtraction
I admit that it looks about the same, but it gets interesting when you subtract the old data from the new data, to find the difference between now and mid-2006:
So here's my first conclusion, from looking at this graph:- People are moving away from Attribution-NonCommercial-NoDerivs licences and towards Attribution-NonCommercial licences. I.e. people are tending towards allowing modifications of their works.
The jurisdiction/version dimension
Another way of looking at the data is by jurisdiction and version, instead of by the licences' attributes. Here's the data from June 2006, organised this way:
First, note that there was no data (at the time) for Australian version 1.0 and 2.5, and US version 2.1 licences. This is simply because not all jurisdictions have all licence versions.Some people might be wondering at this stage why there are Australian web sites using US licences. I believe the reason is that Creative Commons makes it very easy to use US (now generic) licences. See http://creativecommons.org/license/, where the unported licence is the default option.
The previous graph, also, is not particularly interesting in itself, but compare that to the current data:
The move away from Australia version 2.1
You can see straight away that there's lots of change in the 2.1 and 2.5 version licences. But take a look at the change over the last 9 months:
Can that be right? Australian usage of both US and Australian version 2.5 licences has increased as expected (because they are current). But why would the usage of Australian 2.1 licences go down? And by more than the amount of new usage of Australian 2.5 licences? Here are some possibilities:- Some people who were using AU-2.1 licences have switched to AU-2.5, and some have switched to US-2.5 (the latter's a little hard to understand, though).
- The AU-2.1 licence usage has gone down independent of the new licences. It could even be that most of the licences were actually not real licensed works, but, for example, error messages on a web site that has a licence stamp on every page. If the web site is inadvertently exposing countless error messages, when the problem is fixed it could involve this kind of correction.
- Or my original data could have just been wrong. I know it's not cool to suggest this kind of thing: "my data? My data! There's nothing wrong with my data!" Well, even then, it could be that my methods have significant variability.
Methodology
For the record, here's how I collected the data. I did the following Yahoo searches (and 36 others). For each search, Yahoo tells you "about" how many pages are found.
- Australian use of AU-by version 2.5
- Australian use of AU-by-sa version 2.5
- Australian use of AU-by-nd version 2.5
- Australian use of AU-by-nc version 2.5
- Australian use of AU-by-nc-sa version 2.5
- Australian use of AU-by-nc-nd version 2.5
Last word
You can see a graph of the change in usage for every licence for every version and both jurisdictions here.
Labels: ben, Creative Commons, quantification
![]()